
Learning more about
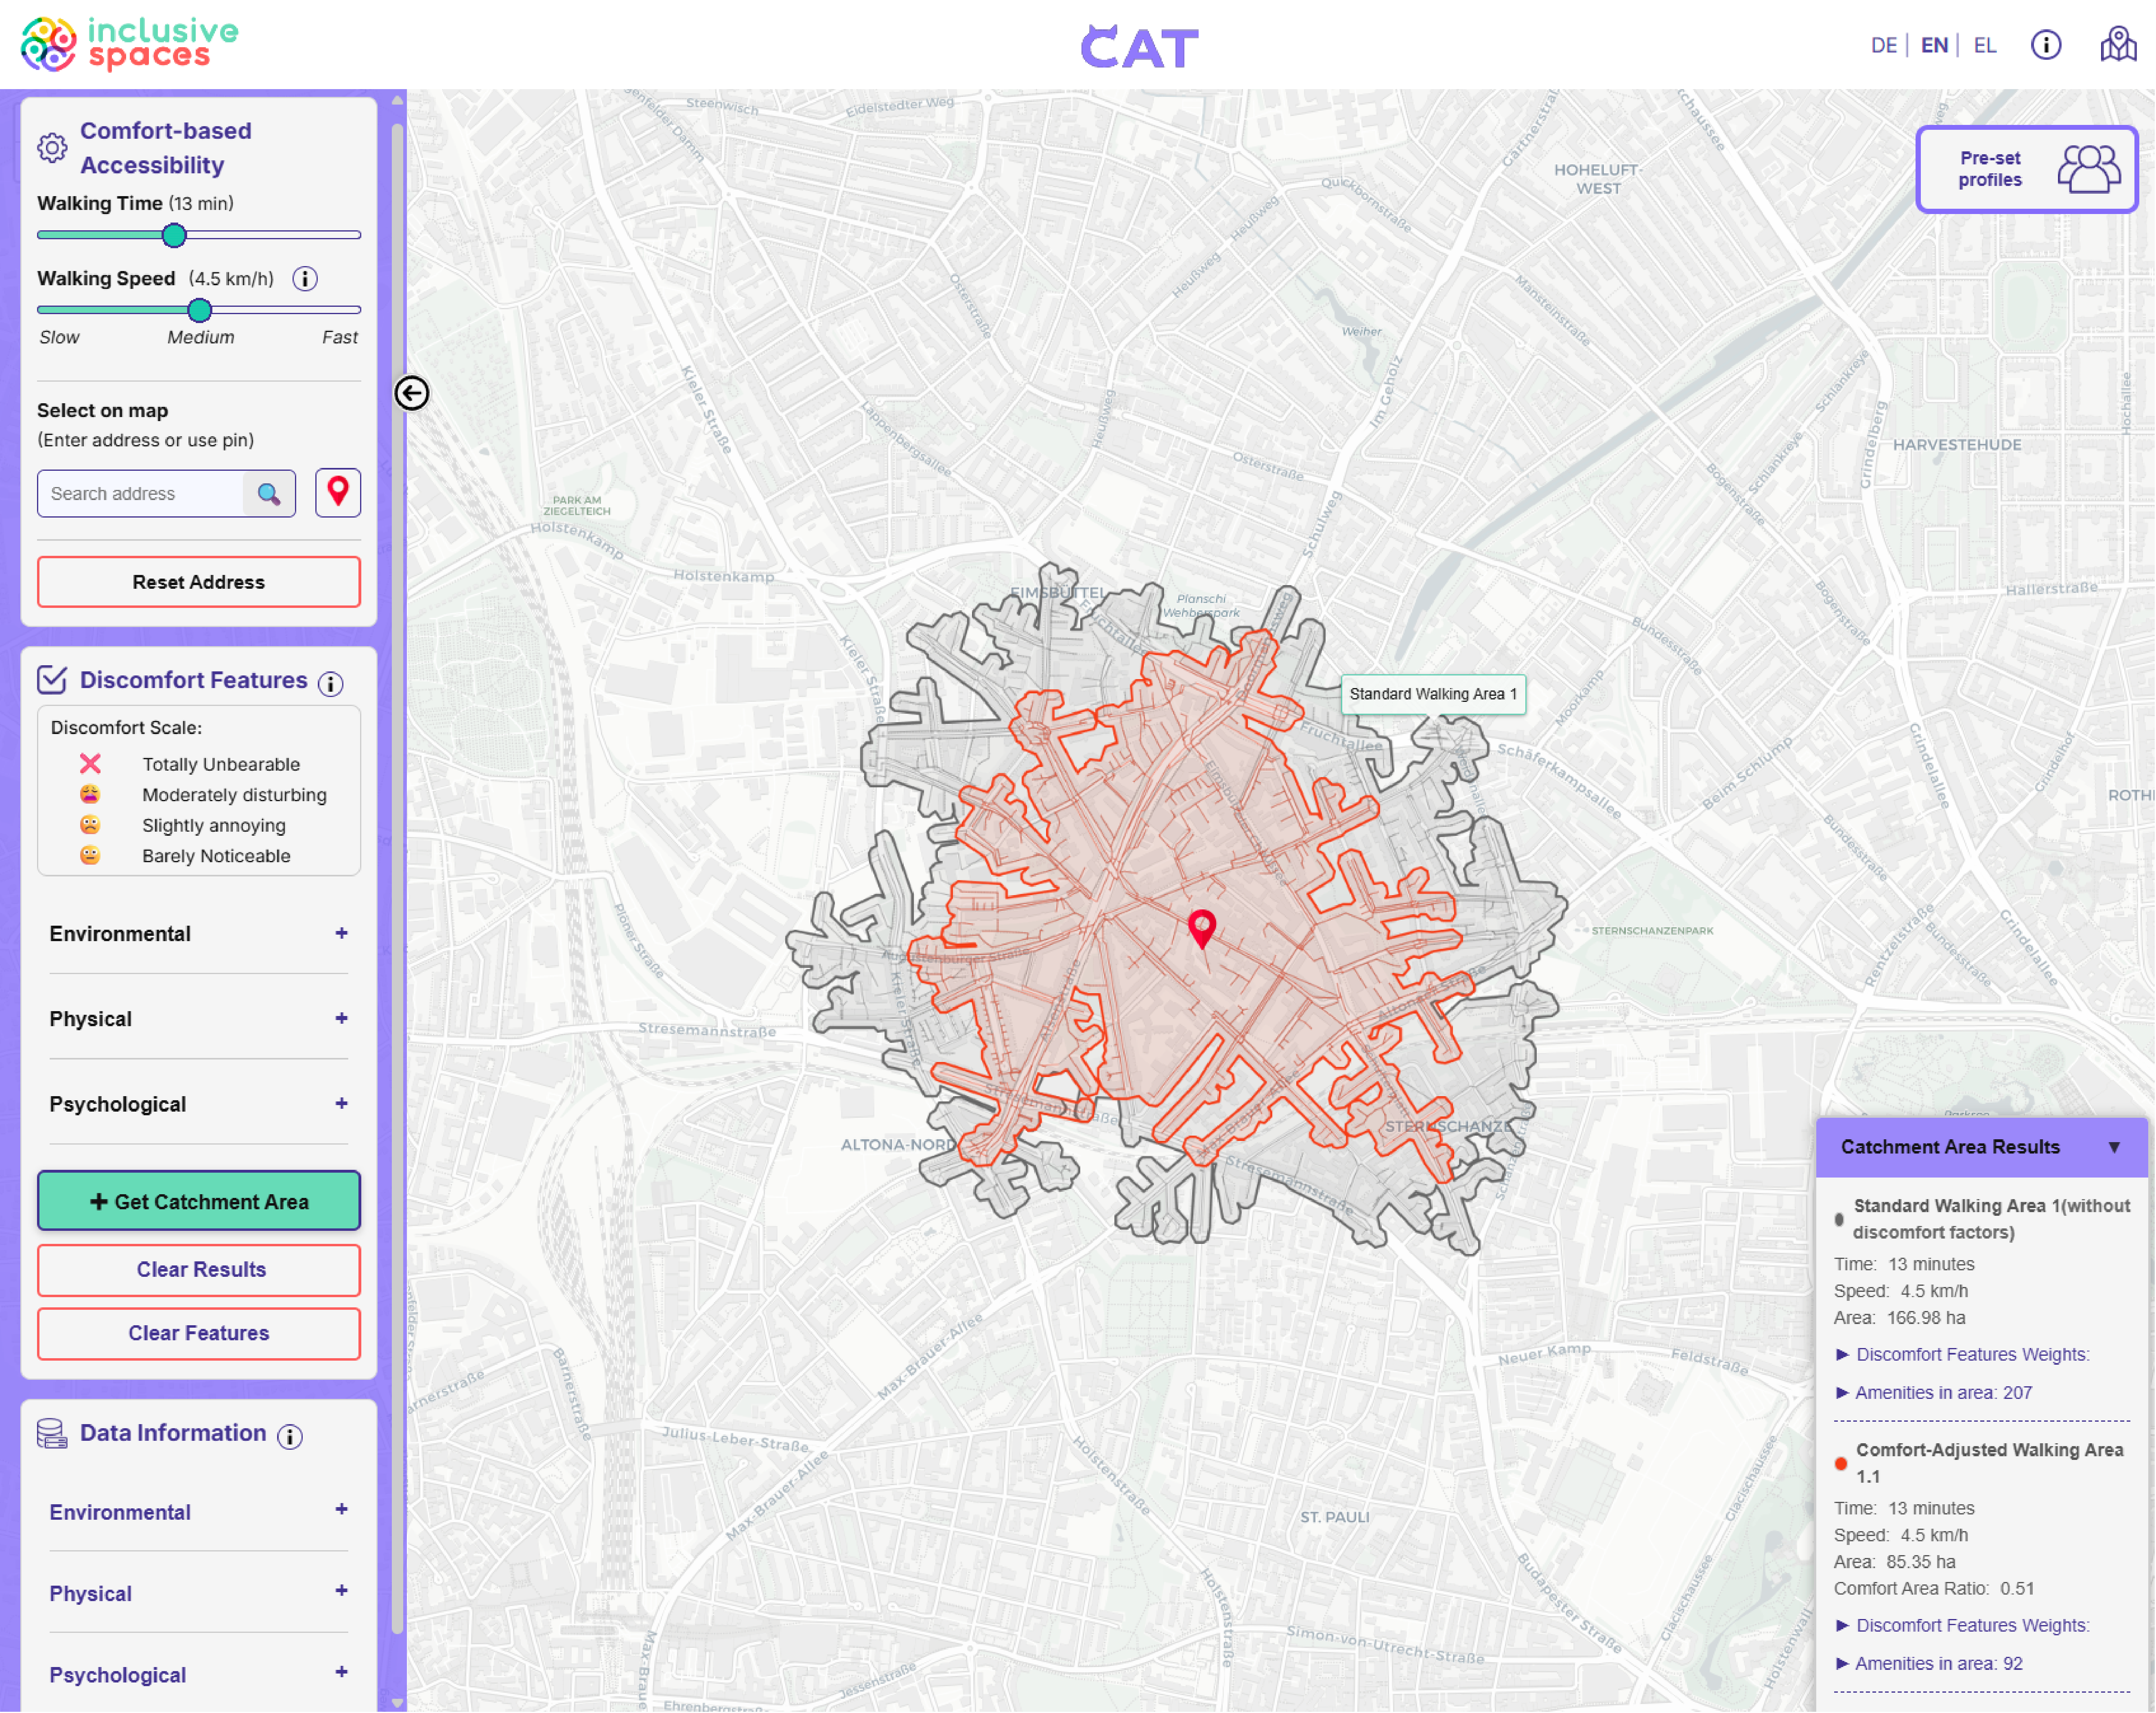
1. What does the CAT interface look like?
2. How to use CAT?
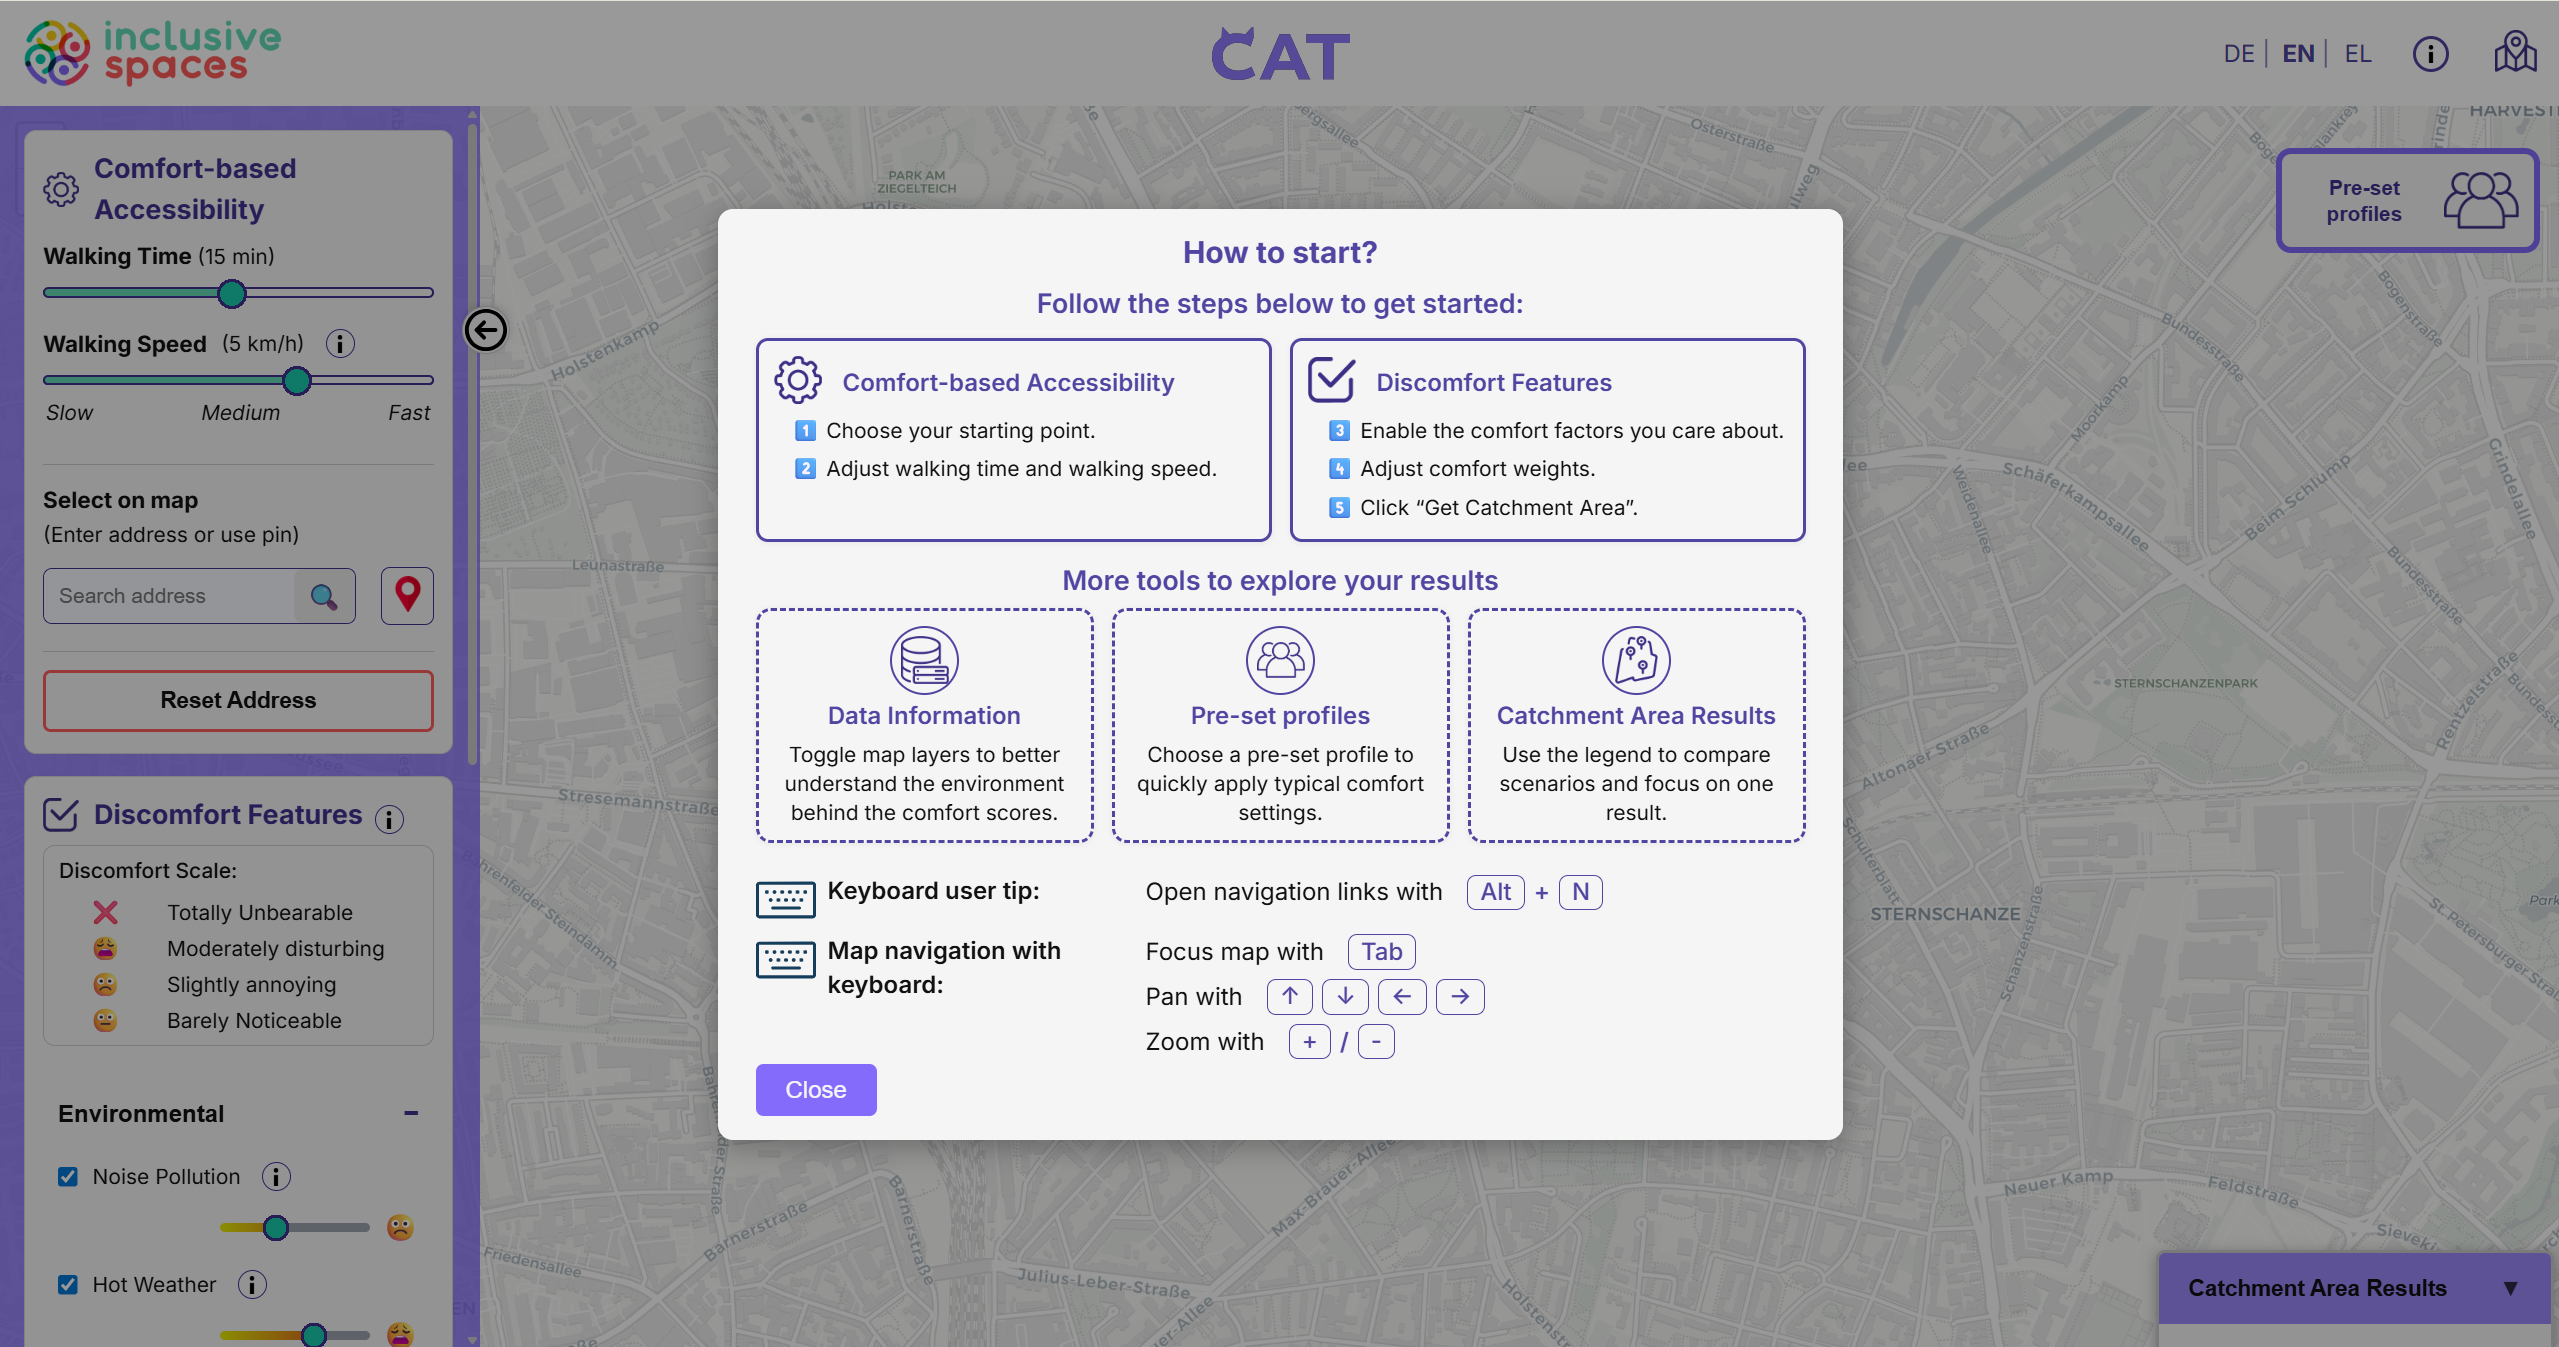
Step 1: Start using CAT
When a city is selected and the map interface is open, a quick start guide introduces the main functions of the tool. It gives users an overview of the workflow and highlights additional tools such as data layers, pre-set profiles, and the result panel.
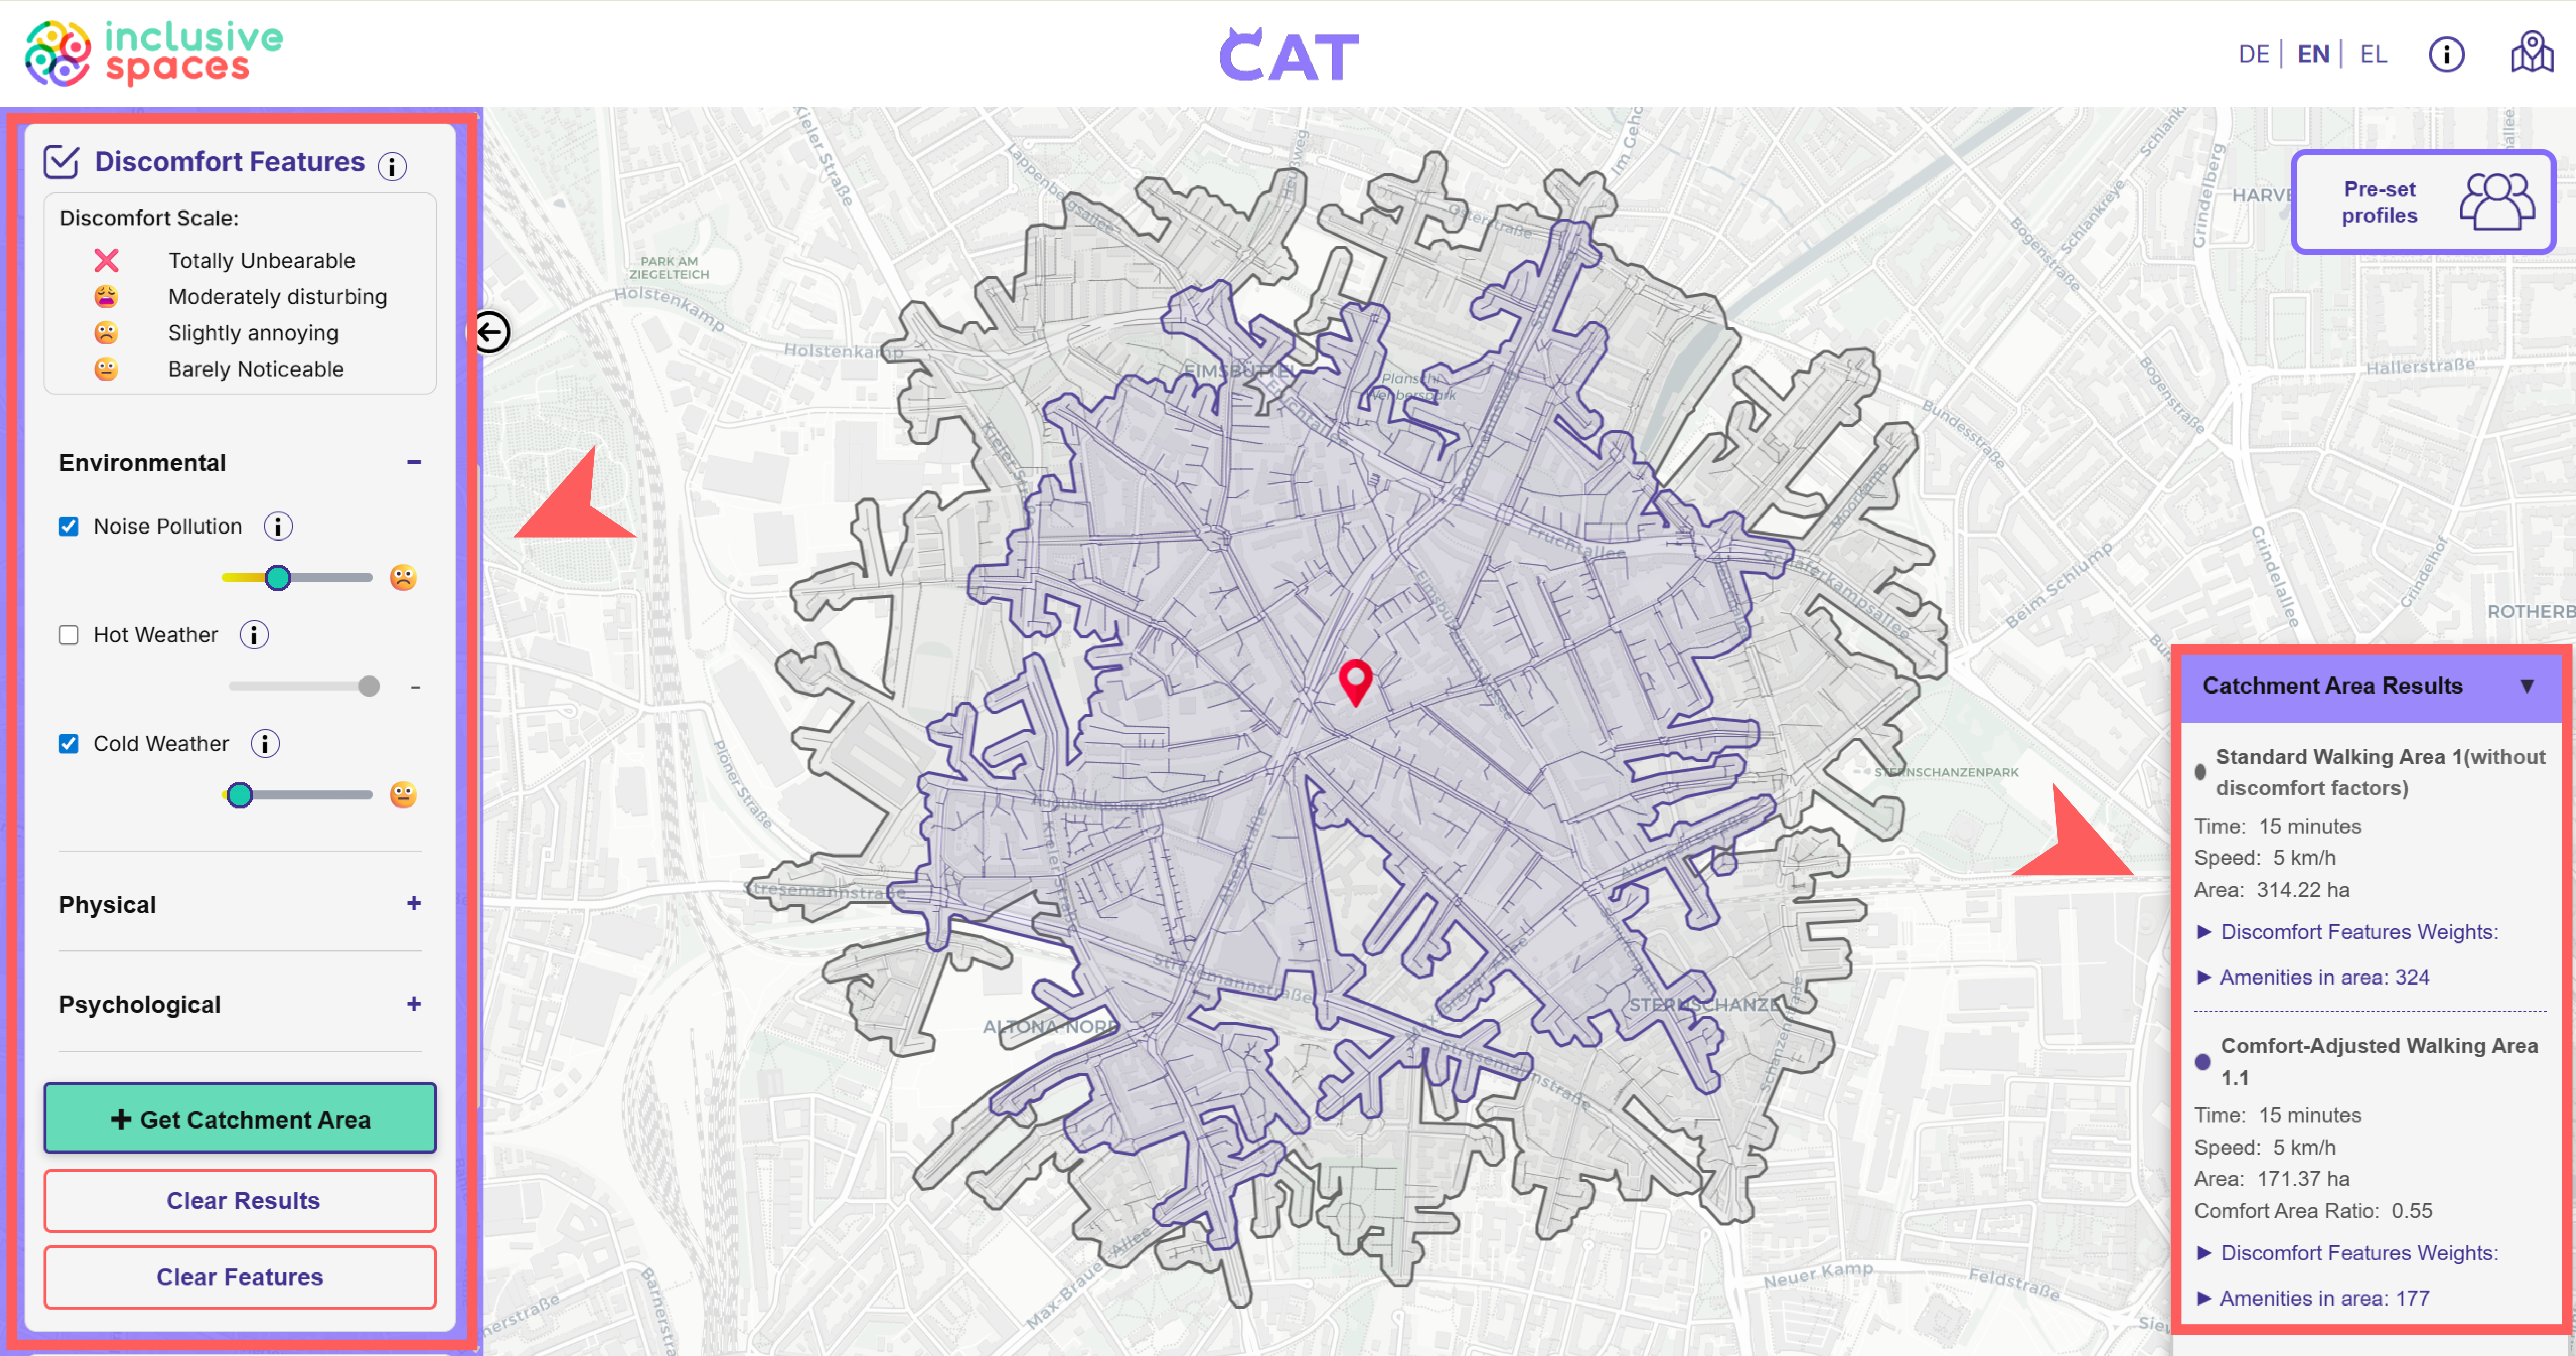
Step 3: Create comfort-based accessibility map
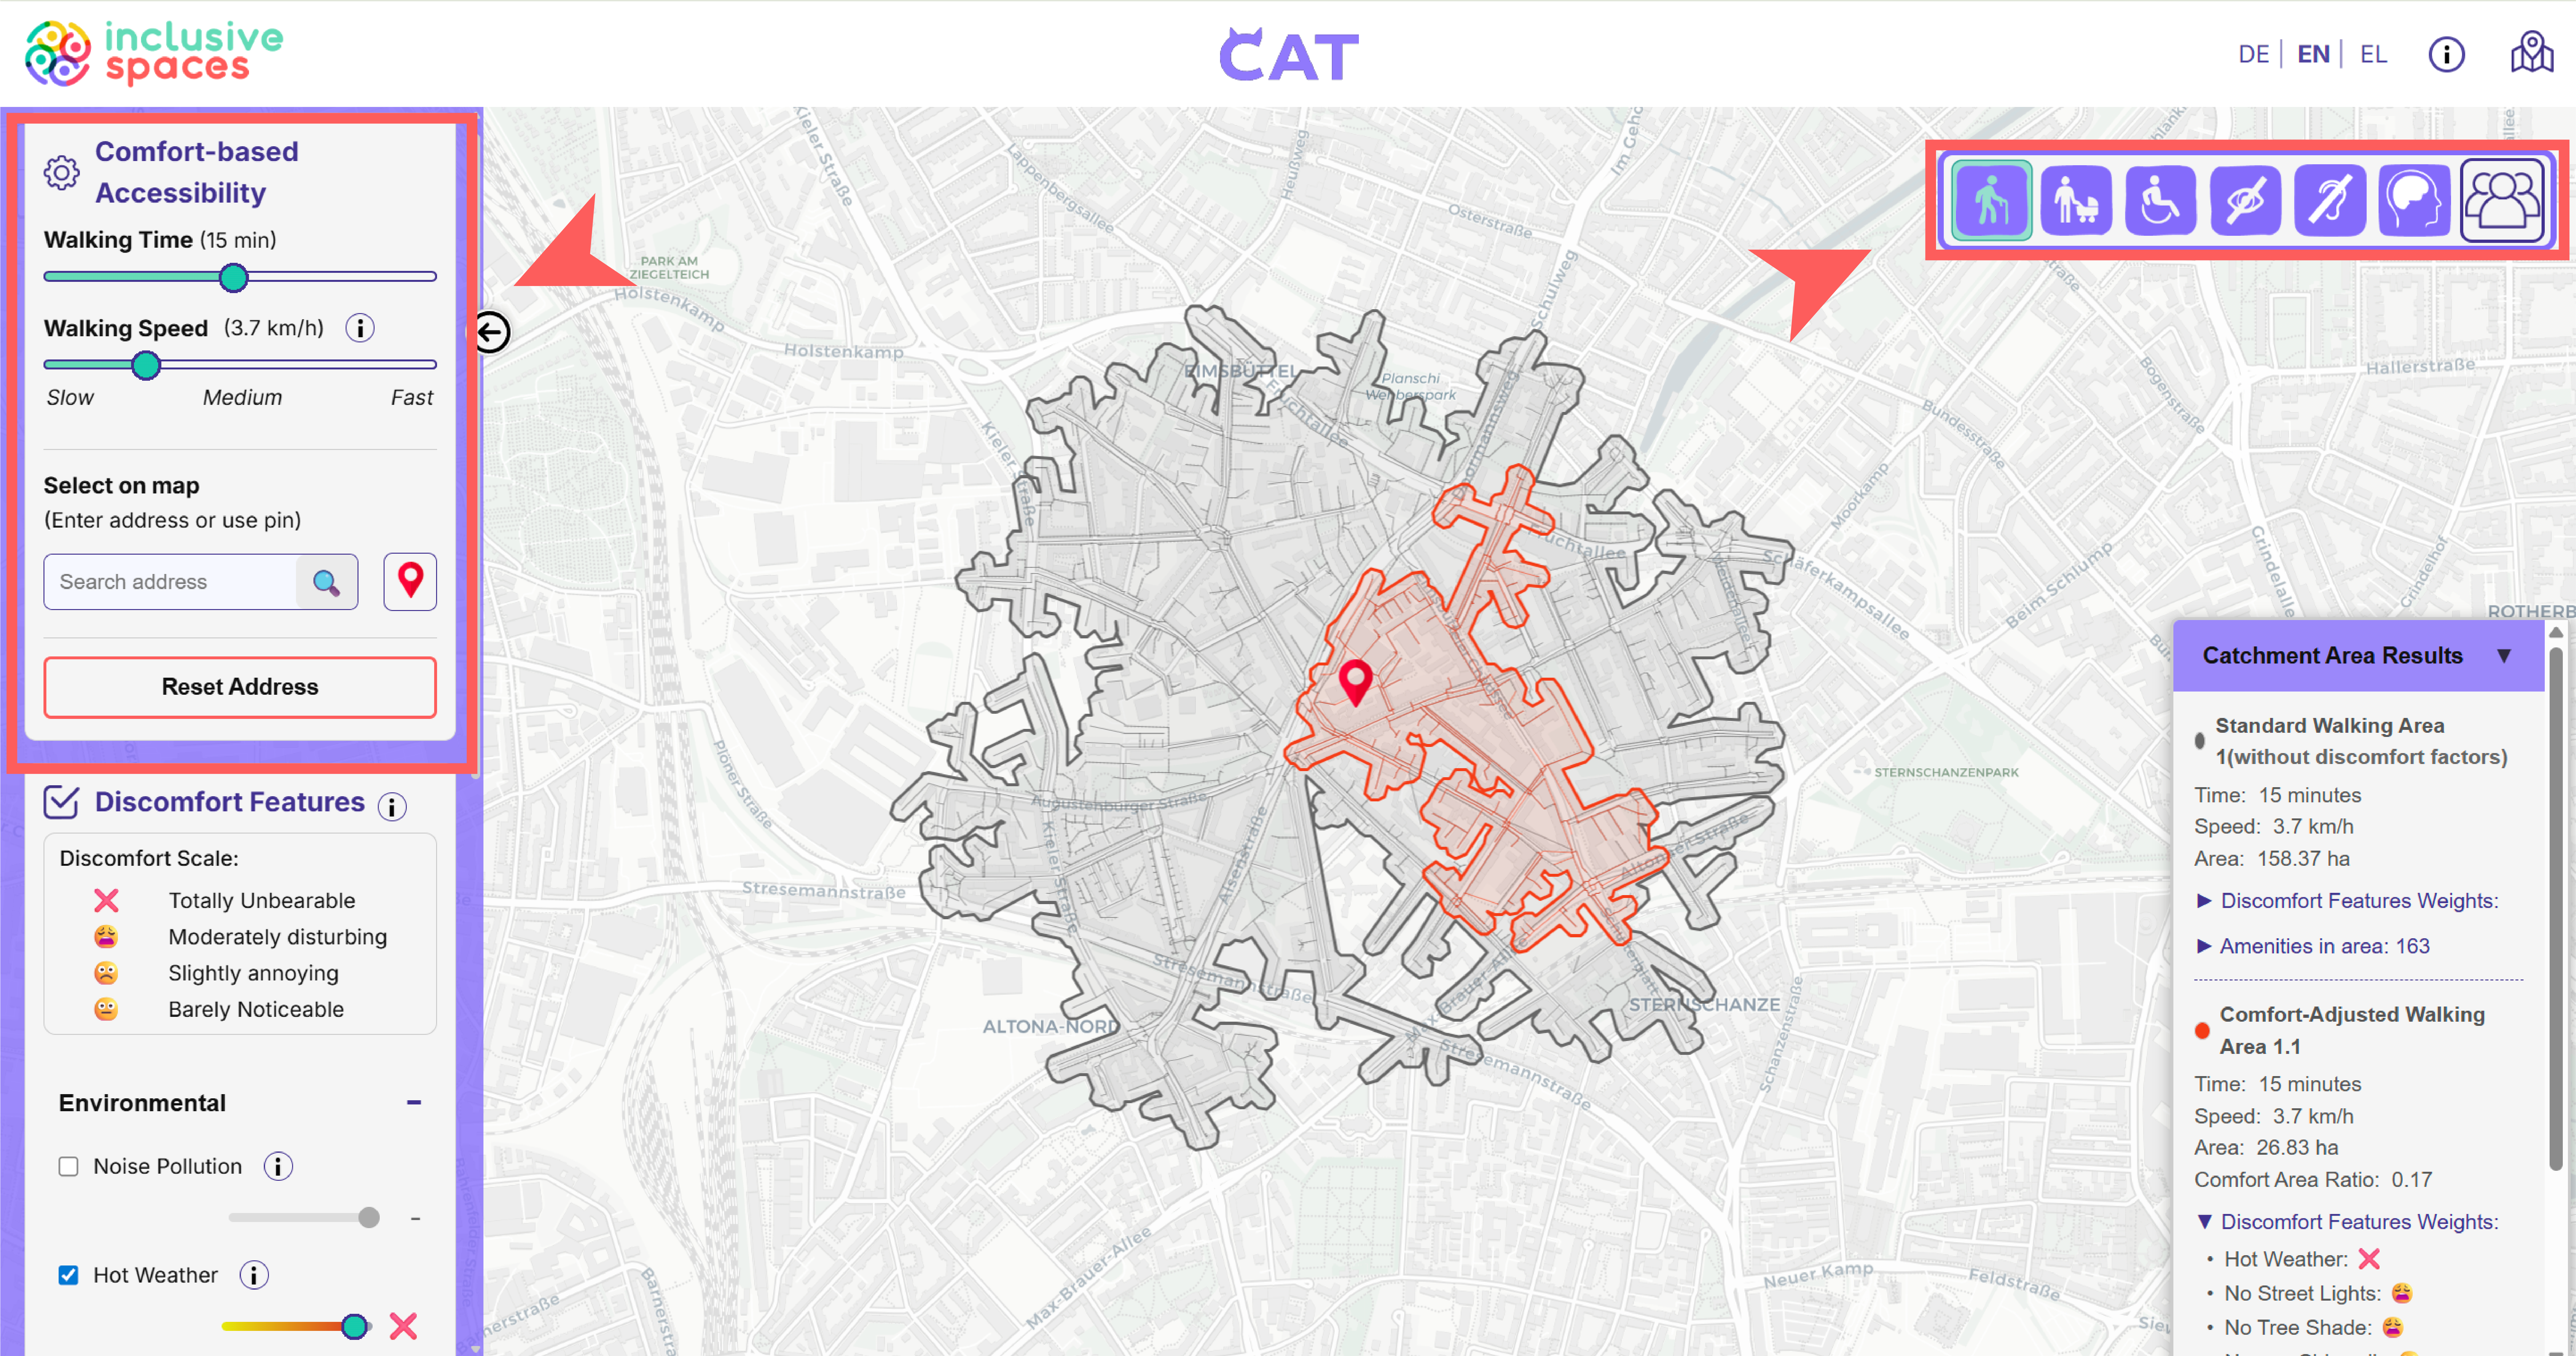
Users can then activate discomfort features and adjust how strongly they should influence the analysis. CAT displays both the standard walking area and the comfort-adjusted walking area, allowing users to compare the results directly.
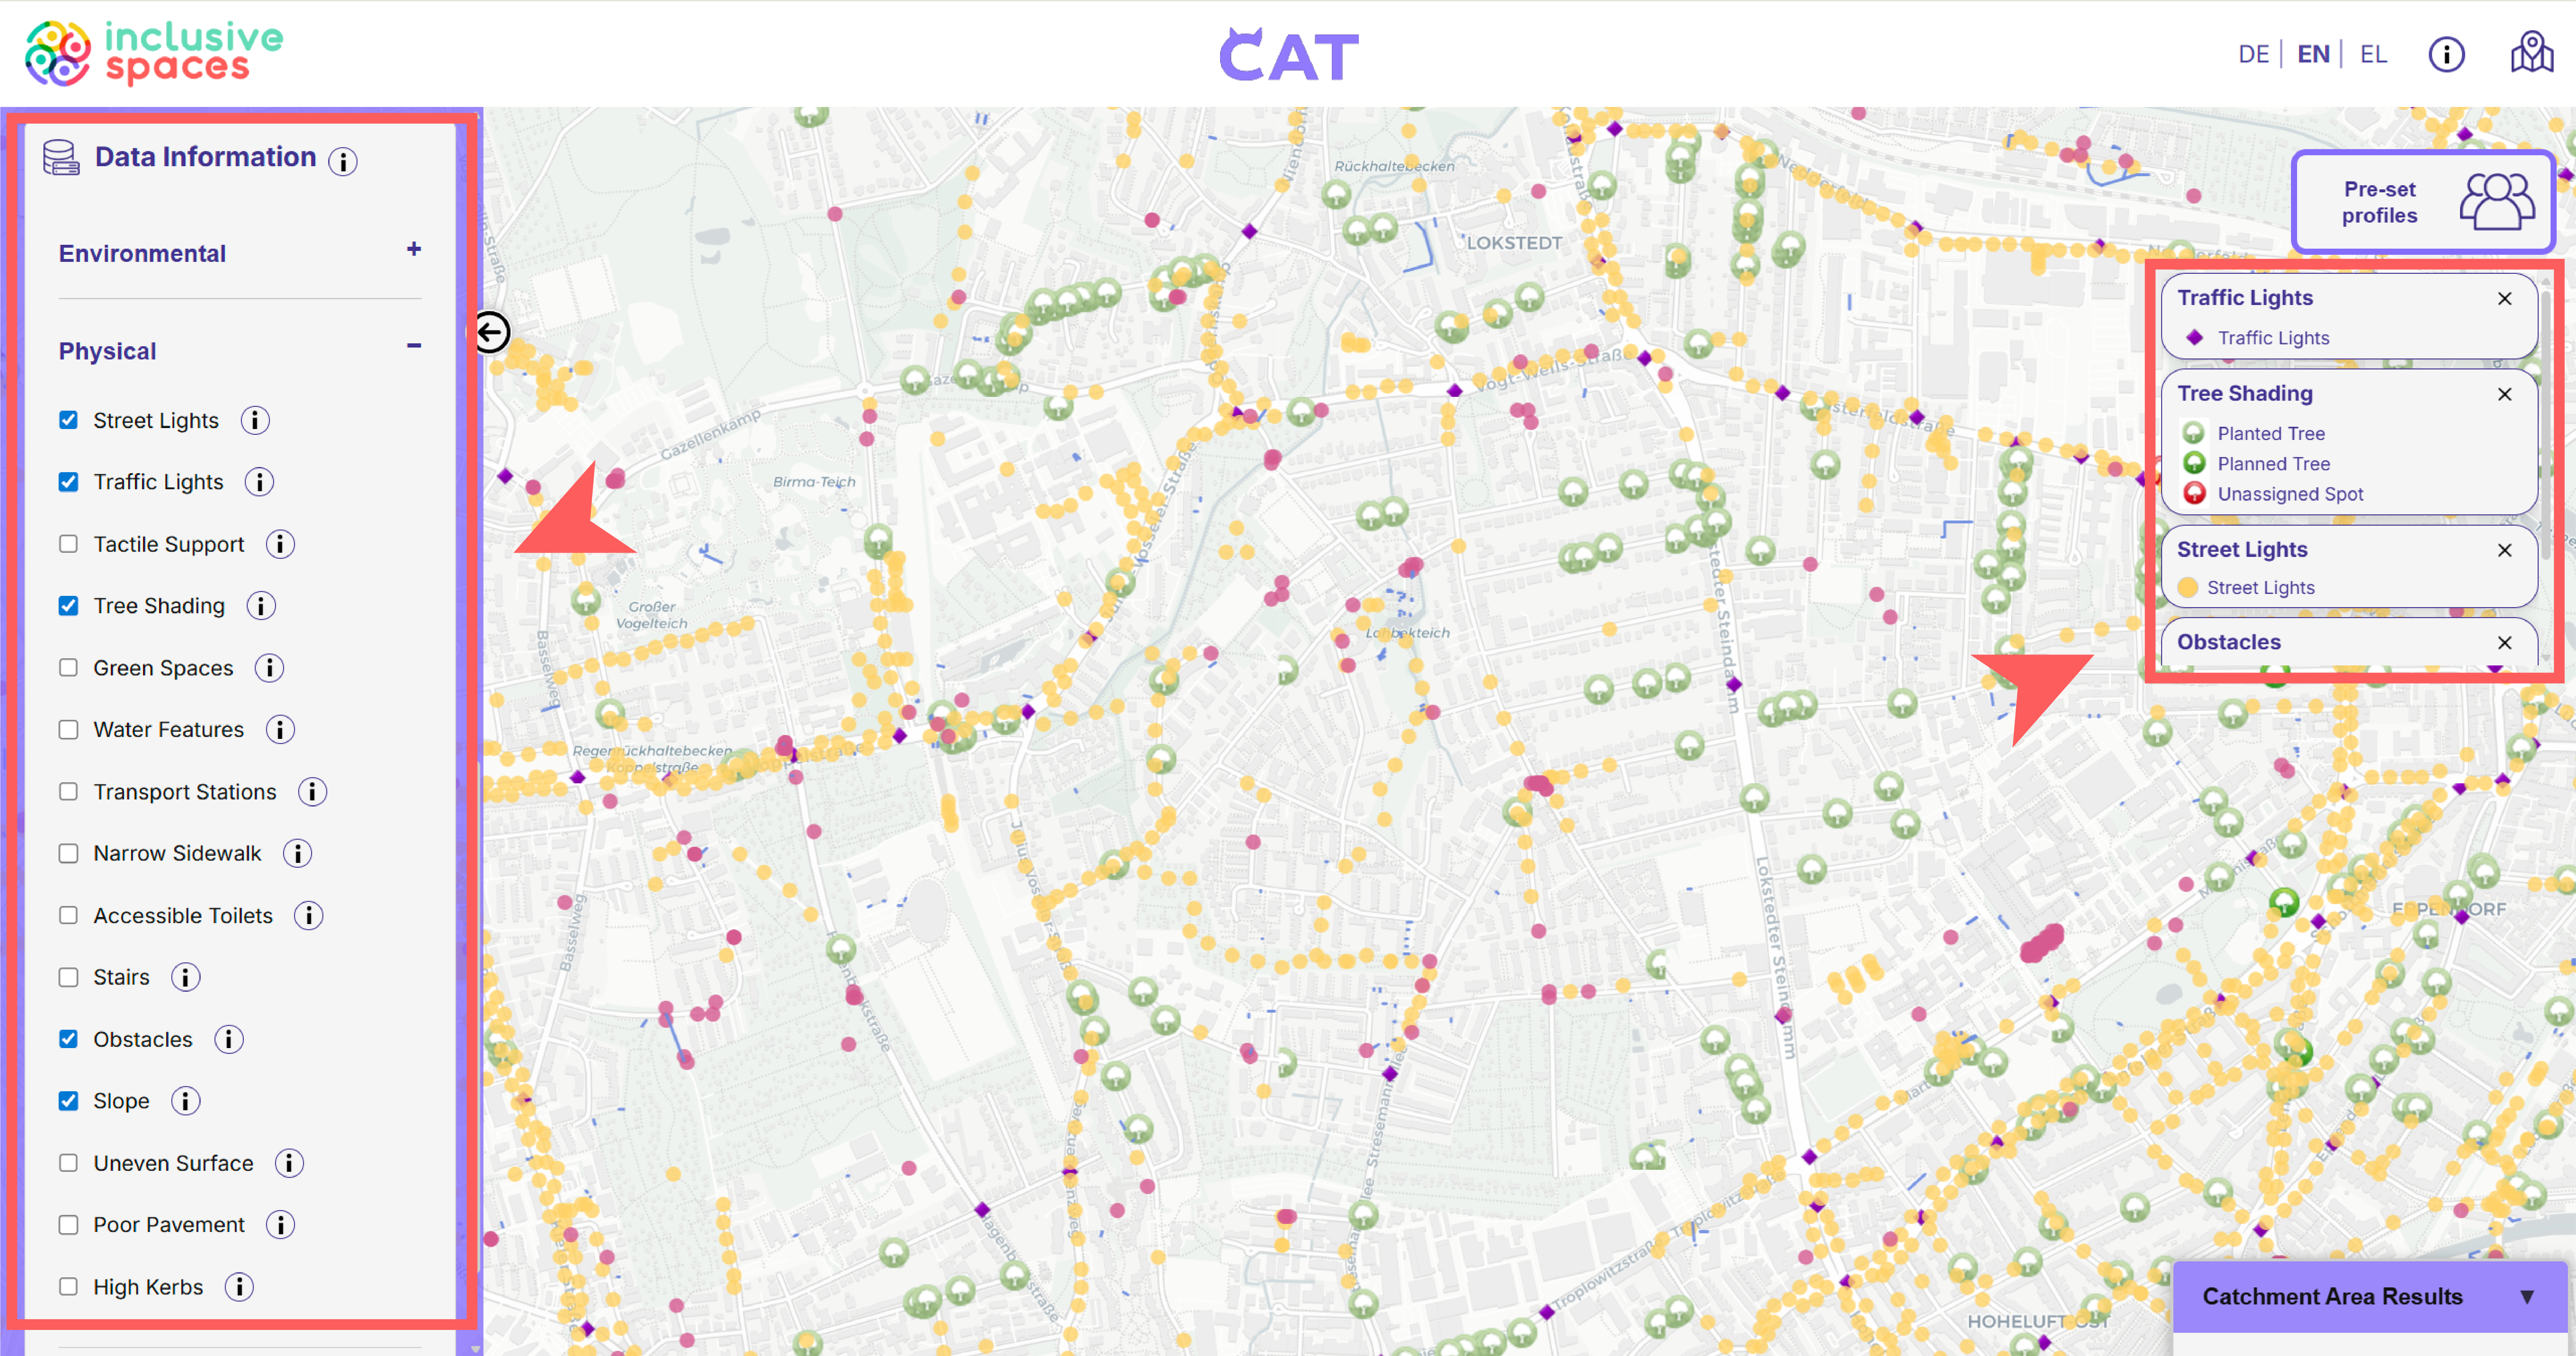
Step 5: Explore map layers (optional)
To better understand the conditions behind the analysis, users can open Data Information and activate additional map layers. These layers provide environmental and accessibility-related information that helps interpret the final result.
Step 2: Create the standard map
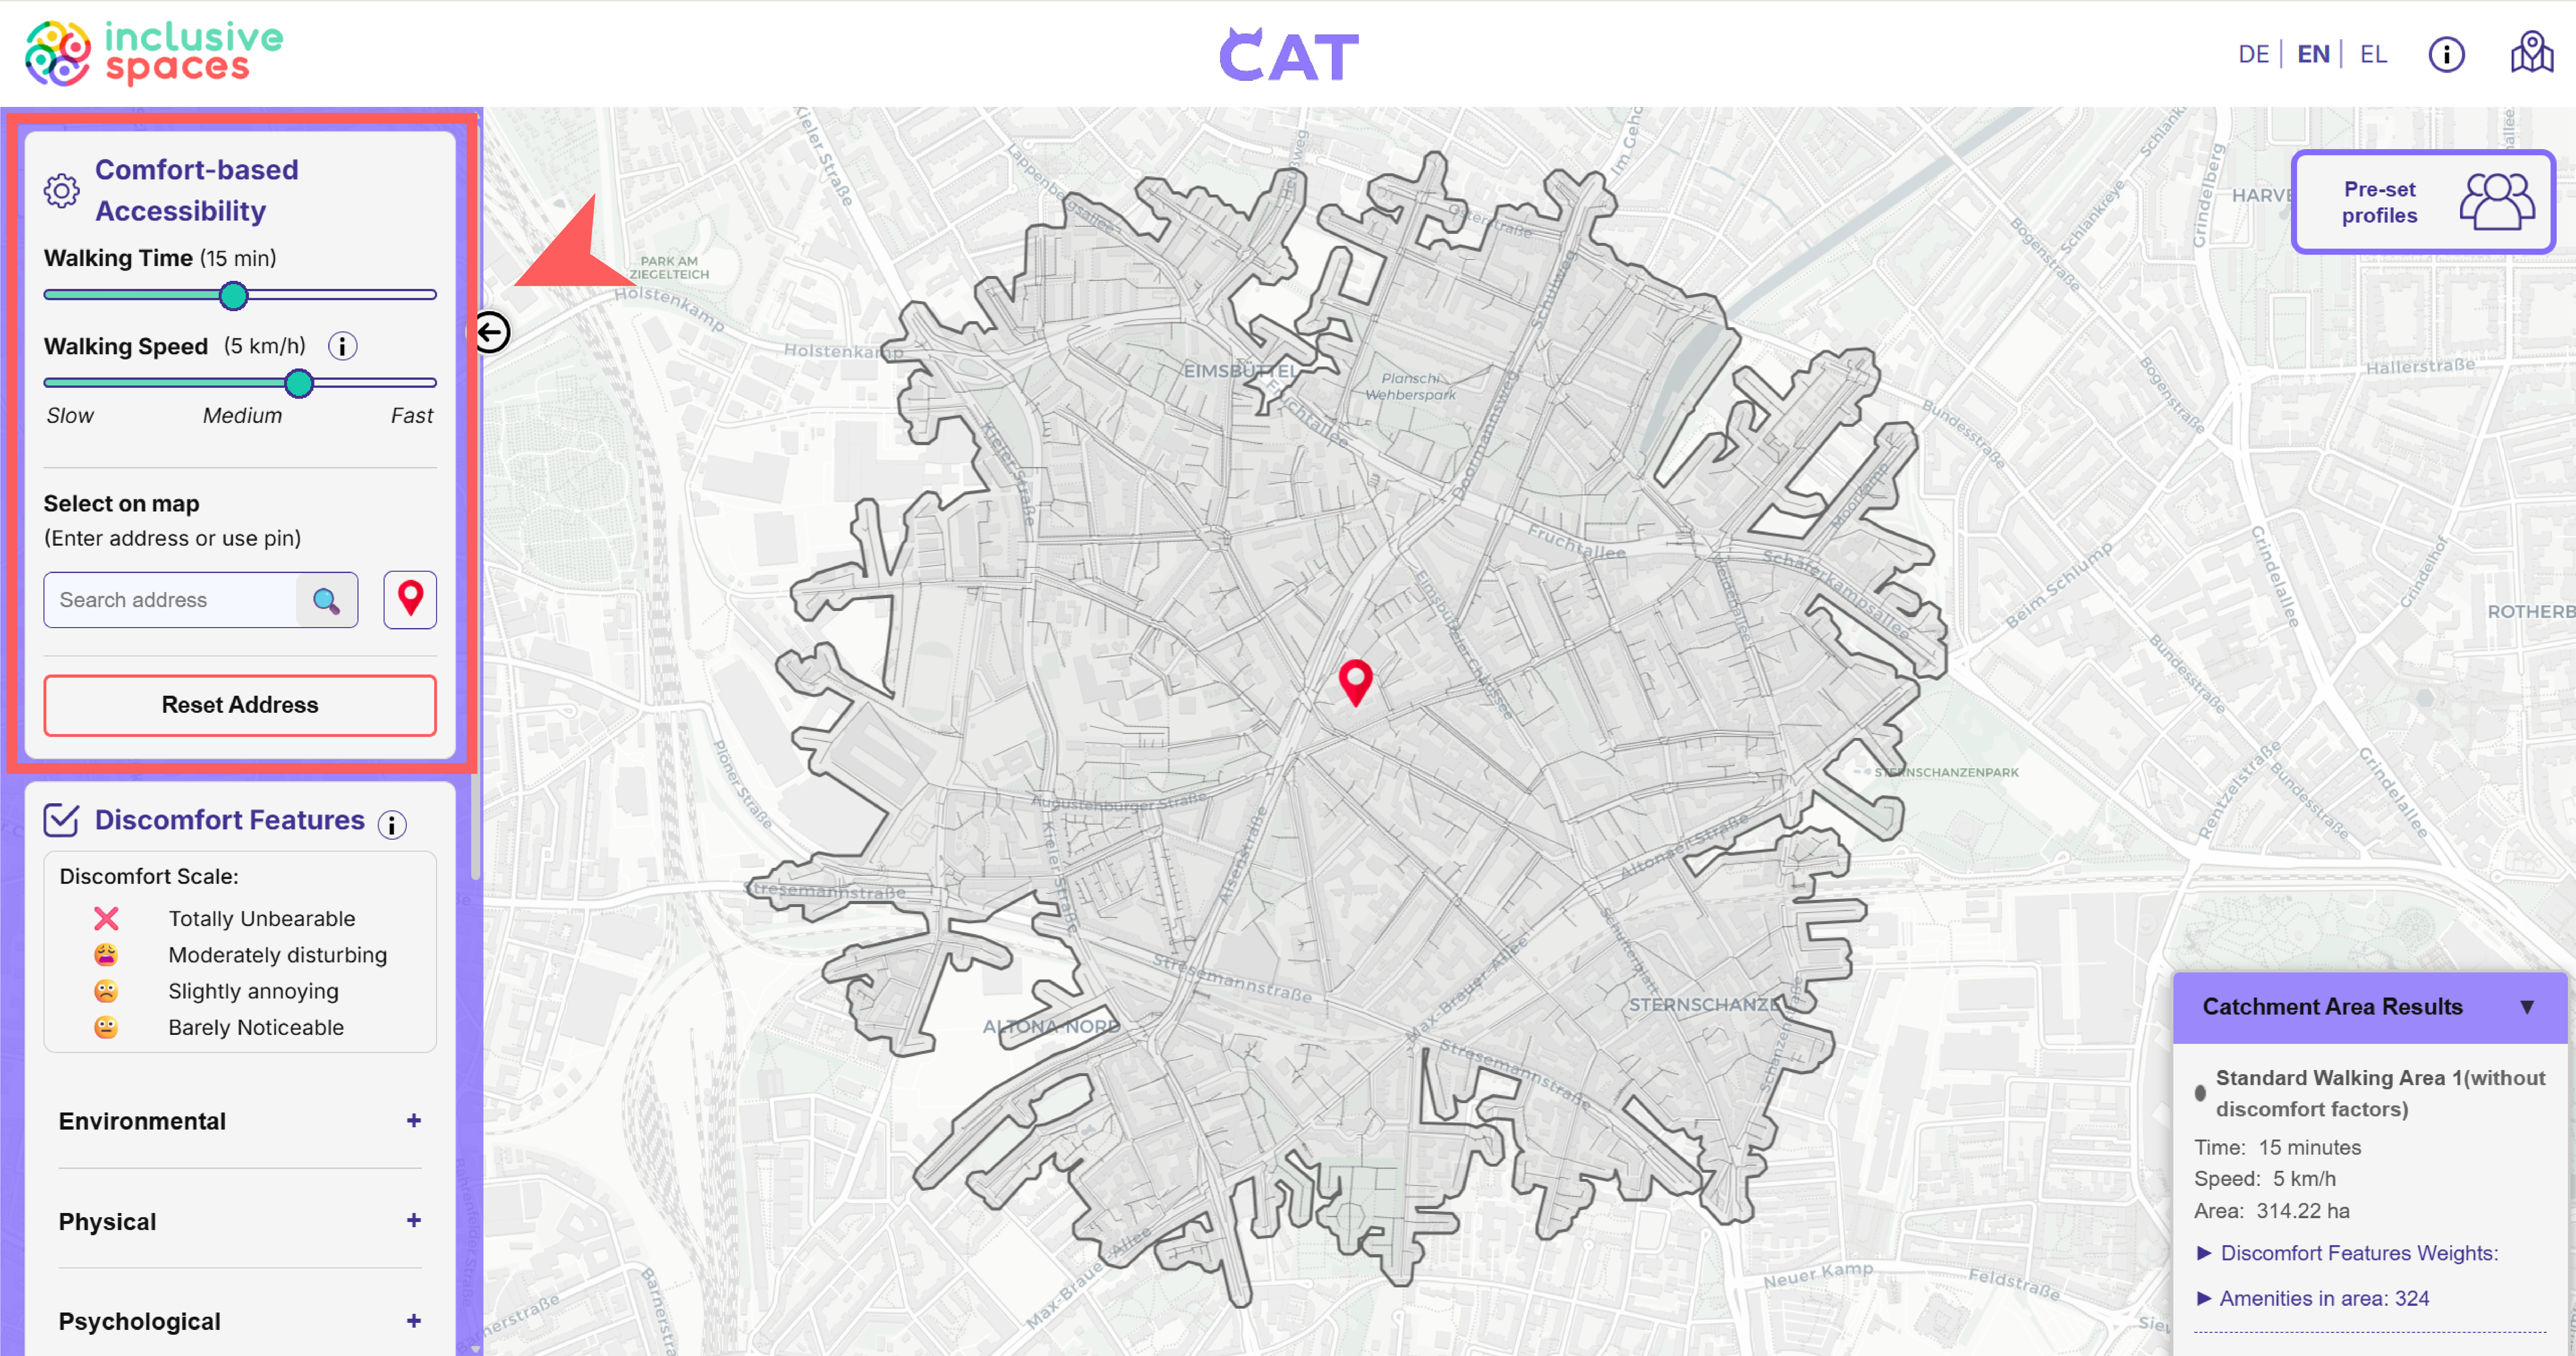
To begin the analysis, users define the main travel settings in the Comfort-based Accessibility panel. This includes selecting the walking time, adjusting walking speed, and setting a starting point either by dragging a marker onto the map or by manually entering an address.
3. Additional features
Step 4: Apply pre-set profiles (optional)
Instead of selecting every factor manually, users can also choose a pre-set profile. These profiles apply predefined settings that reflect different needs and offer a quicker way to generate a comfort-based result.
4. Research basis
The Comfort-Based Accessibility Tool (CAT) helps explore walking accessibility while accounting for comfort-related barriers that affect people with different mobility capacities. It builds on established network-based accessibility methods and extends them to reflect how environmental conditions influence real-world walking decisions.
Where CAT comes from
CAT is based on earlier distance-oriented walking accessibility tools, in particular the SmartHubs Accessibility Tool (more info). These earlier tools measured accessibility mainly through walking time and speed from a chosen starting point. Experience with these approaches showed that assuming uniform walking ability limits how results can be interpreted for groups such as older adults, wheelchair users, or people with sensory or cognitive impairments. CAT maintains the same routing-based concept while adding comfort-related constraints to improve interpretability.
What makes CAT different
CAT introduces comfort and barrier considerations into walking accessibility analysis:
- Comfort constraints (such as steep gradients, surface quality, crossings, or lighting) can reduce effective walking reach.
- Barriers that are experienced as non-traversable are treated as impassable in the network rather than as simply slower routes.
- Results allow comparison between a baseline scenario (without comfort constraints) and comfort-penalized scenarios, making assumptions explicit and outcomes easier to interpret.
To avoid unrealistic results, multiple comfort effects are combined in a stabilized way, ensuring that accessibility does not collapse simply because several constraints are selected at once.
Evidence-based development
CAT was developed using three complementary evidence streams:
- Interviews with mobility experts and people in vulnerable mobility situations identified which conditions are experienced as barriers, when people reroute or avoid areas, and how sensitivities differ across mobility capacities.
- Co-creation with Communities of Practice ensured that indicators are relevant for planning and can be represented through stable, city-scale spatial datasets that municipalities can maintain.
- User testing with planners, experts, and citizens informed improvements to the interface, defaults, explanations, and workflows so that results are understandable and credible for different users.
Together, these steps ensure that CAT is grounded in lived experience, feasible in municipal practice, and usable in planning and exploratory contexts.
Mobility profiles
CAT offers predefined mobility profiles that reflect typical sensitivities and walking speeds derived from empirical evidence (for example for wheelchair users, older adults, or people with visual impairments). These profiles support consistent comparisons across user groups and scenarios while keeping assumptions transparent.
The mobility profiles are based on qualitative interview data from interviews with 79 persons with mobility impairments, located in Larnaca (Cyprus), Hamburg (Germany), Geneva (Switzerland), Budapest (Hungary), Madrid (Spain) and Penteli/Athens (Greece). A scientific paper on the interview analysis progress is currently under review and will be linked here as soon as possible.
The implemented mobility profiles consolidate discomfort factors reported by people with specific mobility impairments. They do not constitute statistically derived groupings but instead reflect a conceptually and qualitatively informed clustering based on empirical interview findings.
Reference List:
Knapstad, M. K., Naterstad, I., & Bogen, B. (2023). The association between cognitive impairment, gait speed, and Walk ratio. Frontiers in Aging Neuroscience, 15, 1092990. https://doi.org/10.3389/fnagi.2023.1092990
Li, L., Simonsick, E. M., Ferrucci, L., & Lin, F. R. (2013). Hearing loss and gait speed among older adults in the United States. Gait & Posture, 38(1), 25-29. https://doi.org/10.1016/j.gaitpost.2012.10.006
Nakamura, T. (1997). Quantitative analysis of gait in the visually impaired. Disability and Rehabilitation, 19(5), 194-197. https://doi.org/10.3109/09638289709166526
Shi, L., Xie, Q., Cheng, X., Chen, L., Zhou, Y., & Zhang, R. (2009). Developing a database for emergency evacuation model. Building and Environment, 44(8), 1724-1729. https://doi.org/10.1016/j.buildenv.2008.11.008
5. What do you need to set up CAT?
CAT relies on both routing data and city-specific environmental information. In order to generate meaningful accessibility results, it needs a street network for calculating reachable areas, as well as additional datasets that describe local conditions related to comfort and accessibility. These data are prepared and connected in the background so that users can explore them through the CAT interface.
Data
CAT relies on several types of data. A street and path network forms the basis for routing and accessibility analysis, while city boundary data and thematic map layers provide additional local context. These layers may include information such as noise, street lights, trees, tactile support, obstacles, slopes, pavement conditions, or nearby facilities. The routing network is based on OpenStreetMap data, and further city-specific geographic data can be taken from official sources. In Hamburg, for example, such data can be obtained through Geoportal Hamburg. If available, some datasets can also be used as WMS services for visualization in CAT. Datasets needed for the actual accessibility calculation are processed separately in the background.
Data management
Before these datasets can be used in CAT, they need to be processed and linked to the street network. In the background, environmental information is translated into road-based weight values so that different conditions can influence the accessibility result. For example, point, line, or area datasets are matched to nearby street segments, and these segments are then marked according to whether a factor is present or relevant. The processed routing data and related weight fields are managed in Supabase, which supports the database structure used by CAT. For more technical details about the project structure and database workflow, please see the project GitHub repository.

The Comfort-Based Accessibility Tool (CAT) is a tool created within the InclusiveSpaces Project.
InclusiveSpaces is a Horizon Europe project supported by the European Commission under Grant Agreement No. 101147881. The UK participants in this project are co-funded by the UK. Views and opinions expressed are however those of the author(s) only and do not necessarily reflect those of the European Union or European Climate, Infrastructure and Environment Executive Agency (CINEA). Neither the European Union nor the granting authority can be held responsible for them.
Contact: